
A quick dive into the importance of pivot tables in data analysis and how to achieve it in PostgreSQL
Pivot tables are a critical tool in data analysis as they provide a way to easily summarize, organize and present large amounts of data in a meaningful and understandable way. By rearranging rows into columns and aggregating data, pivot tables allow data analysts to quickly identify patterns, trends, and relationships in the data.
In PostgreSQL, the crosstab function can be used to create pivot tables and perform same data summarization tasks. With the crosstab function, analysts can easily manipulate the structure of the data to understand better the information it contains thereby greatly enhancing the efficiency and effectiveness of data analysis.
What is Pivot in SQL and why do we use it?
A pivot in SQL allows one to take data that is organized in one way, with rows and columns, and re-organize it into a different structure where some of the rows become columns and some of the columns become rows. This can be useful for creating summary or cross-tabulation reports from data stored in a relational database, allowing one to view the data in a desired format.
What is crosstab function?
The crosstab function in PostgreSQL is a tool that can be used to create pivot tables from data stored in a relational database. It can be used to rearrange or reshape your data in a meaningful way so that it’s easier to analyze or understand. It takes one or two SQL queries as input and returns a table with one column for each unique value in a specified column and one row for each unique combination of values in a specified row and column.
How to enable the crosstab function?
The crosstab function is part of the tablefunc extension in PostgreSQL. To use the crosstab function in your SQL queries, you must first enable the tablefunc extension by executing the following SQL command:
CREATE EXTENSION IF NOT EXISTS tablefunc;
This command will check if the tablefunc extension is already installed, and if not, it will install it. Once the tablefunc extension is installed, you can start using the crosstab() function in your SQL queries. It’s important to remember that the crosstab function is not available by default in PostgreSQL and requires the tablefunc extension to be installed and enabled.
How does the crosstab function work?
As discussed above, the crosstab function in PostgreSQL works by taking one or two SQL SELECT commands as parameters. This blog covers the one which takes two SELECT commands as parameters.
crosstab(text source_sql, text category_sql)
The first parameter source_sql must return at least 3 columns.
- The first column is used as the identifier for each row in the pivot table.
- The second column represents the categories in the pivot table, and it’s important to note that the values of this column will expand into many columns in the pivot table.
- The third column represents the value to be assigned to each cell of the pivot table.
The second parameter category_sql should return all the distinct values of the second column in the source_sql in the same order they are going to display as columns in the pivot table.
Let’s see the working of the crosstab function based on a problem statement.
Problem Statement
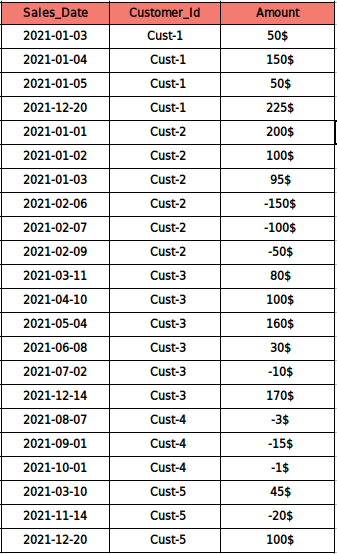
Transform the following input table
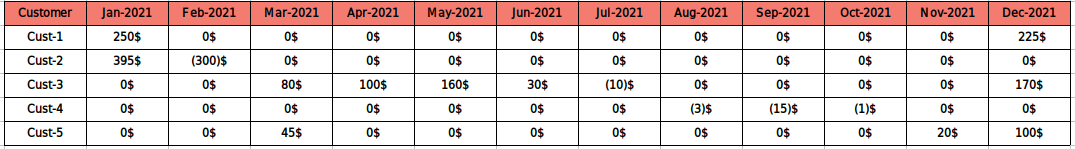
into the following output table. (Need to enclose negative values in round brackets)
**Note:** The PostgreSQL client that I am using here is the Postgres terminal itself.
          So the commands to set up the database and the table will be based on the same.
Setting up Database
--Create a database named sales---
CREATE DATABASE sales;

--Once the database is created, run the following command to access the database--
\\c sales
Setting up a table and inserting data
Save the below SQL script in a .sql file. Let’s call the file crosstab.sql.
--Drop, if any table exists with the name sales_data--
drop table sales_data;

--Create the table named sales_data containing the monthly sales data of different customers--
create table sales_data
    (
        sales_date      date,
        customer_id     varchar(30),
        amount          varchar(30)
    );

--Insert data into the table--
insert into sales_data values (to_date('03-Jan-2021','dd-mon-yyyy'), 'Cust-1', '50$');
insert into sales_data values (to_date('04-Jan-2021','dd-mon-yyyy'), 'Cust-1', '150$');
insert into sales_data values (to_date('05-Jan-2021','dd-mon-yyyy'), 'Cust-1', '50$');
insert into sales_data values (to_date('20-Dec-2021','dd-mon-yyyy'), 'Cust-1', '225$');
insert into sales_data values (to_date('01-Jan-2021','dd-mon-yyyy'), 'Cust-2', '200$');
insert into sales_data values (to_date('02-Jan-2021','dd-mon-yyyy'), 'Cust-2', '100$');
insert into sales_data values (to_date('03-Jan-2021','dd-mon-yyyy'), 'Cust-2', '95$');
insert into sales_data values (to_date('06-Feb-2021','dd-mon-yyyy'), 'Cust-2', '-150$');
insert into sales_data values (to_date('07-Feb-2021','dd-mon-yyyy'), 'Cust-2', '-100$');
insert into sales_data values (to_date('09-Feb-2021','dd-mon-yyyy'), 'Cust-2', '-50$');
insert into sales_data values (to_date('11-Mar-2021','dd-mon-yyyy'), 'Cust-3', '80$');
insert into sales_data values (to_date('10-Apr-2021','dd-mon-yyyy'), 'Cust-3', '100$');
insert into sales_data values (to_date('04-May-2021','dd-mon-yyyy'), 'Cust-3', '160$');
insert into sales_data values (to_date('08-Jun-2021','dd-mon-yyyy'), 'Cust-3', '30$');
insert into sales_data values (to_date('02-Jul-2021','dd-mon-yyyy'), 'Cust-3', '-10$');
insert into sales_data values (to_date('14-Dec-2021','dd-mon-yyyy'), 'Cust-3', '170$');
insert into sales_data values (to_date('07-Aug-2021','dd-mon-yyyy'), 'Cust-4', '-3$');
insert into sales_data values (to_date('01-Sep-2021','dd-mon-yyyy'), 'Cust-4', '-15$');
insert into sales_data values (to_date('01-Oct-2021','dd-mon-yyyy'), 'Cust-4', '-1$');
insert into sales_data values (to_date('10-Mar-2021','dd-mon-yyyy'), 'Cust-5', '45$');
insert into sales_data values (to_date('14-Nov-2021','dd-mon-yyyy'), 'Cust-5', '-20$');
insert into sales_data values (to_date('20-Dec-2021','dd-mon-yyyy'), 'Cust-5', '100$');
Let’s go back to the PostgreSQL terminal and after accessing the database, run the following command to run the crosstab.sql script to create the table sales_data and insert data into it.
\\i 'crosstab.sql'
Note: For running the script, make sure you use the absolute path of the.sql file.
Now let’s display the table sales_data
-- Display all the data from the sales_data table--
SELECT * FROM sales_data;
The table obtained will be the input table.
 sales_date | customer_id | amount
------------+-------------+--------
 2021-01-03 | Cust-1      | 50$
 2021-01-04 | Cust-1      | 150$
 2021-01-05 | Cust-1      | 50$
 2021-12-20 | Cust-1      | 225$
 2021-01-01 | Cust-2      | 200$
 2021-01-02 | Cust-2      | 100$
 2021-01-03 | Cust-2      | 95$
 2021-02-06 | Cust-2      | -150$
 2021-02-07 | Cust-2      | -100$
 2021-02-09 | Cust-2      | -50$
 2021-03-11 | Cust-3      | 80$
 2021-04-10 | Cust-3      | 100$
 2021-05-04 | Cust-3      | 160$
 2021-06-08 | Cust-3      | 30$
 2021-07-02 | Cust-3      | -10$
 2021-12-14 | Cust-3      | 170$
 2021-08-07 | Cust-4      | -3$
 2021-09-01 | Cust-4      | -15$
 2021-10-01 | Cust-4      | -1$
 2021-03-10 | Cust-5      | 45$
 2021-11-14 | Cust-5      | -20$
 2021-12-20 | Cust-5      | 100$
Now let’s create the output table in a step-by-step manner.
Step 1 – Generate a table that displays the monthly amount of sales for each customer
source_sql query
SELECT customer_id, to_char(sales_date, 'MM-YYYY') AS sales_month,
SUM(CAST(REPLACE(amount,'$', '') as integer)) as amount
FROM sales_data GROUP BY customer_id, sales_month ORDER BY 1,2;
In the source_sql, I have changed the sales_date format to ‘MM-YYYY’ with a new alias sales_month. The reason for doing so is to sort the same in ascending order of month and year. Also removed the ‘$’ symbol from the amount and type cast to the integer type in order to find the monthly amount of each customer.
Here the first column customer_id is used as the identifier for each row in the pivot table, the second column sales_month represents the categories in the pivot table and the third column amount represents the value to be assigned to each cell of the pivot table.
It’s mandatory that the source_sql always include order by 1,2 clause so that the same row names customer_id with their corresponding categories sales_month (sorted in ascending order) are grouped together.
 customer_id | sales_month | amount
-------------+-------------+--------
 Cust-1      | 01-2021     |    250
 Cust-1      | 12-2021     |    225
 Cust-2      | 01-2021     |    395
 Cust-2      | 02-2021     |   -300
 Cust-3      | 03-2021     |     80
 Cust-3      | 04-2021     |    100
 Cust-3      | 05-2021     |    160
 Cust-3      | 06-2021     |     30
 Cust-3      | 07-2021     |    -10
 Cust-3      | 12-2021     |    170
 Cust-4      | 08-2021     |     -3
 Cust-4      | 09-2021     |    -15
 Cust-4      | 10-2021     |     -1
 Cust-5      | 03-2021     |     45
 Cust-5      | 11-2021     |    -20
 Cust-5      | 12-2021     |    100
Step 2 – Display all the distinct months with year in the same order they display on the pivot table
category_sql query
SELECT DISTINCT to_char(sales_date, 'MM-YYYY') sales_month FROM sales_data ORDER BY 1;
There is a condition that while using category_sql in the crosstab function, they should be ordered in a specific way as we display categories in the pivot table.
So here the above query ****returns the list of sales_month in ascending order (from Jan-2021 to Dec-2021) in the same order as we are planning to display month and year in the pivot table to achieve the given output.
sales_month
-------------
 01-2021
 02-2021
 03-2021
 04-2021
 05-2021
 06-2021
 07-2021
 08-2021
 09-2021
 10-2021
 11-2021
 12-2021
Step 3 – Generate the pivot table using crosstab function
SQL query using crosstab()
SELECT * FROM crosstab(
 'SELECT customer_id,
        to_char(sales_date, ''MM-YYYY'') AS sales_month,
        SUM(CAST(REPLACE(amount,''$'', '''') as integer)) as amount
  FROM sales_data
  GROUP BY customer_id, sales_month
  ORDER BY 1,2',
 'SELECT DISTINCT to_char(sales_date, ''MM-YYYY'') sales_month
  FROM sales_data
  ORDER BY sales_month ASC')
 AS ("Customer" VARCHAR,
     "Jan-2021" BIGINT, "Feb-2021" BIGINT, "Mar-2021" BIGINT, "Apr-2021" BIGINT,
     "May-2021" BIGINT, "Jun-2021" BIGINT, "Jul-2021" BIGINT, "Aug-2021" BIGINT,
     "Sep-2021" BIGINT, "Oct-2021" BIGINT, "Nov-2021" BIGINT, "Dec-2021" BIGINT);
Here the crosstab function is invoked in the FROM clause of the SELECT statement. Also, we need to mention the column names with their data types that will go into the pivot table.
In the above query, I have mapped the column customer_id to the column Customer and each distinct value of sales_month to the column name with the format ‘Mon-YYYY’ like ’01-2021’ to ‘Jan-2021’, ‘02-2021’ to ‘Feb-2021’, and so on.
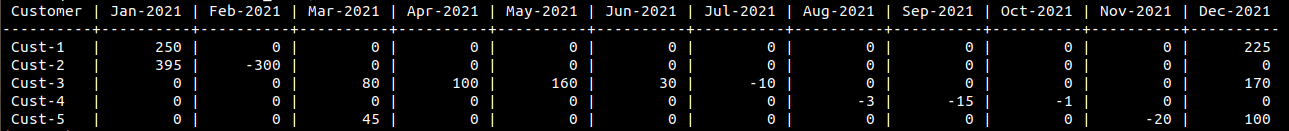
The pivot table will be
 Customer | Jan-2021 | Feb-2021 | Mar-2021 | Apr-2021 | May-2021 | Jun-2021 | Jul-2021 | Aug-2021 | Sep-2021 | Oct-2021 | Nov-2021 | Dec-2021
----------+----------+----------+----------+----------+----------+----------+----------+----------+----------+----------+----------+----------
 Cust-1   |      250 |          |          |          |          |          |          |          |          |          |          |      225
 Cust-2   |      395 |     -300 |          |          |          |          |          |          |          |          |          |
 Cust-3   |          |          |       80 |      100 |      160 |       30 |      -10 |          |          |          |          |      170
 Cust-4   |          |          |          |          |          |          |          |       -3 |      -15 |       -1 |          |
 Cust-5   |          |          |       45 |          |          |          |          |          |          |          |      -20 |      100
In the above table, in each row, the Customer acts as a unique identifier with 12 separate columns to represent 12 months where each column holds the monthly amount of each customer.

Step 4 – Add 0 to columns having NULL values
WITH
monthly_sales AS (
SELECT * FROM crosstab(
 'SELECT customer_id,
        to_char(sales_date, ''MM-YYYY'') AS sales_month,
        SUM(CAST(REPLACE(amount,''$'', '''') as integer)) as amount
  FROM sales_data
  GROUP BY customer_id, sales_month
  ORDER BY 1,2',
 'SELECT DISTINCT to_char(sales_date, ''MM-YYYY'') sales_month
  FROM sales_data
  ORDER BY sales_month ASC')
 AS ("Customer" VARCHAR,
     "Jan-2021" BIGINT, "Feb-2021" BIGINT, "Mar-2021" BIGINT, "Apr-2021" BIGINT,
     "May-2021" BIGINT, "Jun-2021" BIGINT, "Jul-2021" BIGINT, "Aug-2021" BIGINT,
     "Sep-2021" BIGINT, "Oct-2021" BIGINT, "Nov-2021" BIGINT, "Dec-2021" BIGINT)
),
final_data AS (
SELECT "Customer",
        coalesce("Jan-2021",0) AS "Jan-2021",
        coalesce("Feb-2021",0) AS "Feb-2021",
        coalesce("Mar-2021",0) AS "Mar-2021",
        coalesce("Apr-2021",0) AS "Apr-2021",
        coalesce("May-2021",0) AS "May-2021",
        coalesce("Jun-2021",0) AS "Jun-2021",
        coalesce("Jul-2021",0) AS "Jul-2021",
        coalesce("Aug-2021",0) AS "Aug-2021",
        coalesce("Sep-2021",0) AS "Sep-2021",
        coalesce("Oct-2021",0) AS "Oct-2021",
        coalesce("Nov-2021",0) AS "Nov-2021",
        coalesce("Dec-2021",0) AS "Dec-2021"
FROM monthly_sales)
SELECT * FROM final_data;
Here I have added the crosstab function SQL command within a CTE to apply further changes over the pivot table giving an alias monthly_sales. In the table monthly_sales, I have applied COALESCE function to each month column to add a 0 value if any of them hold a NULL value and named the resulting table as final_data.
 Customer | Jan-2021 | Feb-2021 | Mar-2021 | Apr-2021 | May-2021 | Jun-2021 | Jul-2021 | Aug-2021 | Sep-2021 | Oct-2021 | Nov-2021 | Dec-2021
----------+----------+----------+----------+----------+----------+----------+----------+----------+----------+----------+----------+----------
 Cust-1   |      250 |        0 |        0 |        0 |        0 |        0 |        0 |        0 |        0 |        0 |        0 |      225
 Cust-2   |      395 |     -300 |        0 |        0 |        0 |        0 |        0 |        0 |        0 |        0 |        0 |        0
 Cust-3   |        0 |        0 |       80 |      100 |      160 |       30 |      -10 |        0 |        0 |        0 |        0 |      170
 Cust-4   |        0 |        0 |        0 |        0 |        0 |        0 |        0 |       -3 |      -15 |       -1 |        0 |        0
 Cust-5   |        0 |        0 |       45 |        0 |        0 |        0 |        0 |        0 |        0 |        0 |      -20 |      100
Step 5 – Adding the $ symbol to all the amounts by enclosing negative values in round brackets ()
WITH
monthly_sales AS (
SELECT * FROM crosstab(
 'SELECT customer_id,
        to_char(sales_date, ''MM-YYYY'') AS sales_month,
        SUM(CAST(REPLACE(amount,''$'', '''') as integer)) as amount
  FROM sales_data
  GROUP BY customer_id, sales_month
  ORDER BY 1,2',
 'SELECT DISTINCT to_char(sales_date, ''MM-YYYY'') sales_month
  FROM sales_data
  ORDER BY sales_month ASC')
 AS ("Customer" VARCHAR,
     "Jan-2021" BIGINT, "Feb-2021" BIGINT, "Mar-2021" BIGINT, "Apr-2021" BIGINT,
     "May-2021" BIGINT, "Jun-2021" BIGINT, "Jul-2021" BIGINT, "Aug-2021" BIGINT,
     "Sep-2021" BIGINT, "Oct-2021" BIGINT, "Nov-2021" BIGINT, "Dec-2021" BIGINT)
),
final_data AS (
SELECT "Customer",
        coalesce("Jan-2021",0) AS "Jan-2021",
        coalesce("Feb-2021",0) AS "Feb-2021",
        coalesce("Mar-2021",0) AS "Mar-2021",
        coalesce("Apr-2021",0) AS "Apr-2021",
        coalesce("May-2021",0) AS "May-2021",
        coalesce("Jun-2021",0) AS "Jun-2021",
        coalesce("Jul-2021",0) AS "Jul-2021",
        coalesce("Aug-2021",0) AS "Aug-2021",
        coalesce("Sep-2021",0) AS "Sep-2021",
        coalesce("Oct-2021",0) AS "Oct-2021",
        coalesce("Nov-2021",0) AS "Nov-2021",
        coalesce("Dec-2021",0) AS "Dec-2021"
FROM monthly_sales)
SELECT "Customer",
CASE WHEN "Jan-2021" < 0 THEN CONCAT('(', "Jan-2021" * -1, ')', '$') ELSE CONCAT("Jan-2021",'$') END "Jan-2021",
CASE WHEN "Feb-2021" < 0 THEN CONCAT('(', "Feb-2021" * -1, ')', '$') ELSE CONCAT("Feb-2021",'$') END "Feb-2021",
CASE WHEN "Mar-2021" < 0 THEN CONCAT('(', "Mar-2021" * -1, ')', '$') ELSE CONCAT("Mar-2021",'$') END "Mar-2021",
CASE WHEN "Apr-2021" < 0 THEN CONCAT('(', "Apr-2021" * -1, ')', '$') ELSE CONCAT("Apr-2021",'$') END "Apr-2021",
CASE WHEN "May-2021" < 0 THEN CONCAT('(', "May-2021" * -1, ')', '$') ELSE CONCAT("May-2021",'$') END "May-2021",
CASE WHEN "Jun-2021" < 0 THEN CONCAT('(', "Jun-2021" * -1, ')', '$') ELSE CONCAT("Jun-2021",'$') END "Jun-2021",
CASE WHEN "Jul-2021" < 0 THEN CONCAT('(', "Jul-2021" * -1, ')', '$') ELSE CONCAT("Jul-2021",'$') END "Jul-2021",
CASE WHEN "Aug-2021" < 0 THEN CONCAT('(', "Aug-2021" * -1, ')', '$') ELSE CONCAT("Aug-2021",'$') END "Aug-2021",
CASE WHEN "Sep-2021" < 0 THEN CONCAT('(', "Sep-2021" * -1, ')', '$') ELSE CONCAT("Sep-2021",'$') END "Sep-2021",
CASE WHEN "Oct-2021" < 0 THEN CONCAT('(', "Oct-2021" * -1, ')', '$') ELSE CONCAT("Oct-2021",'$') END "Oct-2021",
CASE WHEN "Nov-2021" < 0 THEN CONCAT('(', "Nov-2021" * -1, ')', '$') ELSE CONCAT("Nov-2021",'$') END "Nov-2021",
CASE WHEN "Dec-2021" < 0 THEN CONCAT('(', "Dec-2021" * -1, ')', '$') ELSE CONCAT("Dec-2021",'$') END "Dec-2021"
FROM final_data;
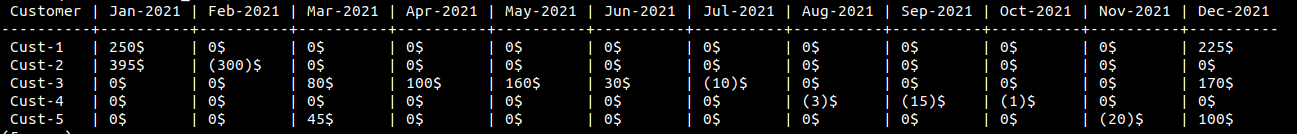
In the above SQL query, for each month column I have applied a CASE statement to find negative values, enclose them in round brackets and finally attach the ‘$’ symbol to all the values using the CONCAT function. To remove the negative sign, multiplied each negative value by -1. Finally, we got the table as per the output displayed above.
 Customer | Jan-2021 | Feb-2021 | Mar-2021 | Apr-2021 | May-2021 | Jun-2021 | Jul-2021 | Aug-2021 | Sep-2021 | Oct-2021 | Nov-2021 | Dec-2021
----------+----------+----------+----------+----------+----------+----------+----------+----------+----------+----------+----------+----------
 Cust-1   | 250$     | 0$       | 0$       | 0$       | 0$       | 0$       | 0$       | 0$       | 0$       | 0$       | 0$       | 225$
 Cust-2   | 395$     | (300)$   | 0$       | 0$       | 0$       | 0$       | 0$       | 0$       | 0$       | 0$       | 0$       | 0$
 Cust-3   | 0$       | 0$       | 80$      | 100$     | 160$     | 30$      | (10)$    | 0$       | 0$       | 0$       | 0$       | 170$
 Cust-4   | 0$       | 0$       | 0$       | 0$       | 0$       | 0$       | 0$       | (3)$     | (15)$    | (1)$     | 0$       | 0$
 Cust-5   | 0$       | 0$       | 45$      | 0$       | 0$       | 0$       | 0$       | 0$       | 0$       | 0$       | (20)$    | 100$
Advantages:
- Easy to use: The crosstab function is easy to use and understand.
- Dynamic columns: Crosstab function allows you to dynamically generate columns based on the data, which makes it easy to create pivot tables with a variable number of columns.
- Consistent data: With the crosstab function, it’s easy to maintain consistency in data, by specifying the values in the order you want them to appear in the pivot table.
- Speed: The crosstab function is relatively fast as it doesn’t require any complex JOINs or subqueries, which makes it suitable for large datasets.
Disadvantages:
- Limited flexibility: The crosstab function is limited in terms of the types of calculations and aggregations that can be performed.
- Not suitable for a large number of columns: Crosstab function is not suitable when the number of columns is large or not known in advance.
- Limited compatibility: The crosstab function is only available in PostgreSQL, and not all other databases support it.
- Error-prone: Since the crosstab function is based on the order of values specified in the query, it’s easy to make mistakes and get unexpected results if the order is not specified correctly.
Conclusion
In summary, the crosstab function in PostgreSQL is an efficient tool for creating pivot tables and cross-tabulation reports, which allow users to re-arrange data in a more meaningful way, making it easier to identify patterns and trends. To utilize the function, tablefunc extension must be installed and enabled, and a good understanding of SQL and the underlying data is required as it can be more complex than a standard pivot function. Using the crosstab function, users can gain a deeper insight into their data and make better decisions.
Thanks for reading and have fun with SQL!
 2026 Hamon Technologies Inc